 BINarrator
Why net leverage tells you more than total debt
A big debt number alone says little. Here is the one ratio that puts it in context, and why you should always see the inputs behind it.
Debt & LiquidityLeverage Analysis
Total debt is the number everyone quotes and the one that tells you the least on its own. Borrowing $3.9 billion is heavy for a company that earns $400 million a year and comfortable for one that earns $1.5 billion. The debt figure only starts to mean something when you set it against two other numbers.
Start with three inputs
Total debt is everything the company owes lenders: bank loans, bonds, and often financing tied to receivables. Cash is what it holds today. EBITDA is a rough measure of yearly operating earnings before interest, tax and non-cash charges. The usual shortcut is operating income plus depreciation and amortization.
Subtract cash, then divide by earnings
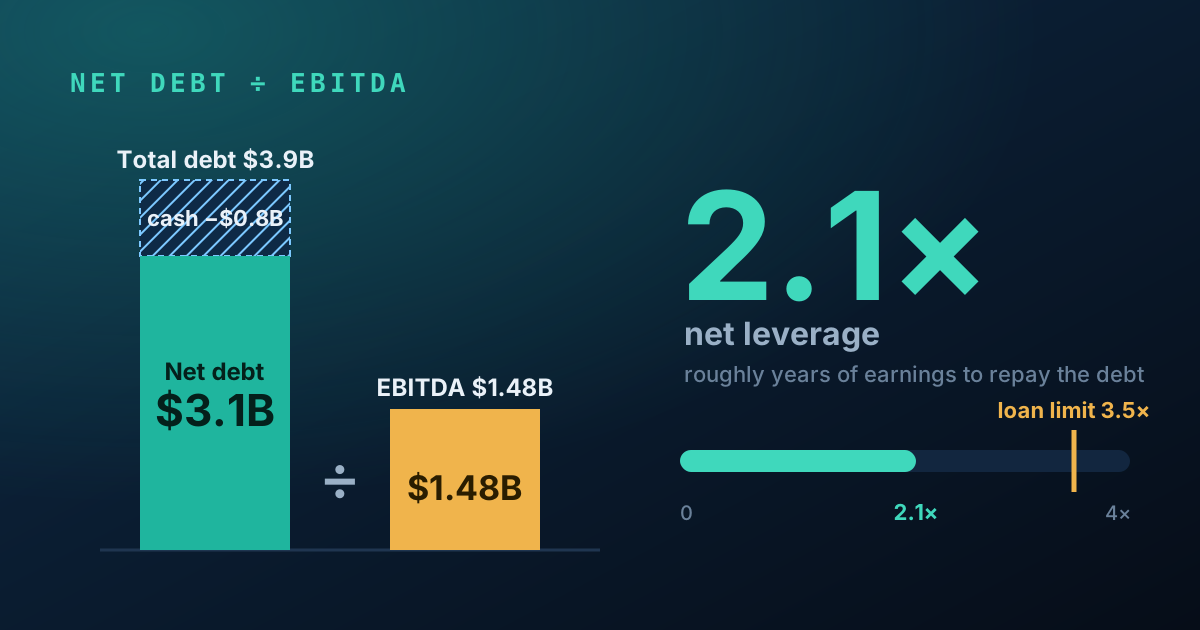
Net debt is total debt minus cash. Net leverage is net debt divided by EBITDA. Read it as a rough count of years of earnings needed to pay the debt down. A company at 2 times is in a very different position from one at 6 times, even if the two owe the same amount.
| Total debt | $3.9B | five instruments: revolver, term loan, two note issues, receivables facility |
| Cash | $0.8B | reported on the balance sheet |
| Net debt | $3.1B | $3.9B minus $0.8B |
| EBITDA | $1.48B | operating income $1.06B plus depreciation and amortization $0.42B |
| Net leverage | 2.1× | $3.1B divided by $1.48B |
Why the ratio alone is not enough
Two analysts can start from the same company and land on different leverage figures. One counts lease obligations as debt and the other does not. One uses the latest year of EBITDA and the other uses an adjusted figure the company prefers. One subtracts all the cash and the other only the cash that is freely available. None of them is wrong, but a ratio without its inputs cannot be compared with anything.
That is why every calculated figure in a BINarrator report lists what went into it, and why each input points to the passage in the company's own documents. If you disagree with a choice, you can see exactly where to change it.
What to watch
- The trend, not one reading. Leverage creeping up for four quarters tells a story a single number hides.
- The limit in the loan agreement. Lenders often cap leverage. How far the company sits below that cap matters more than the ratio itself. The next article covers it.
- What is held back. Cash can be trapped in a foreign subsidiary or needed to run the business, so net debt is a lens, not a promise.
Leverage is an indicator, not a credit rating or a forecast. Meridian Industrial Holdings is an invented company used to show every kind of fact a report holds.
See how every figure in a report links to its source.
Try the sample report