 BINarrator
Debt Maturity Schedules: How to Identify Refinancing Risk
Why the timing of debt repayment may reveal financial pressure before traditional credit ratios do.
Debt & LiquidityRefinancing Risk
A company can be profitable today and still face a serious refinancing problem tomorrow.
The reason is simple: debt has a maturity date.
When a large borrowing becomes due, the company must repay it, refinance it, or negotiate another arrangement with its creditors. Strong historical earnings do not guarantee that capital markets or lenders will provide replacement funding on acceptable terms.
That is why a debt maturity schedule is one of the most important tools in corporate credit analysis.
It reveals not just how much a company owes, but when its financial obligations become unavoidable.
1. What Is a Debt Maturity Schedule?
A debt maturity schedule shows the principal amounts expected to come due over future periods.
Companies often provide this information in the debt footnotes to their annual financial statements, with supplementary detail about particular financing arrangements.
For a credit analyst, the schedule helps answer several questions:
- How much principal is due within the next 12 months?
- Are repayments spread evenly or concentrated in a particular year?
- Can expected cash generation support those repayments?
- Does the company have access to refinancing or additional liquidity?
- What happens if operating performance weakens or borrowing costs increase?
The key is to evaluate contractual repayments together with liquidity, future cash generation, and financing conditions.
2. A Practical Example
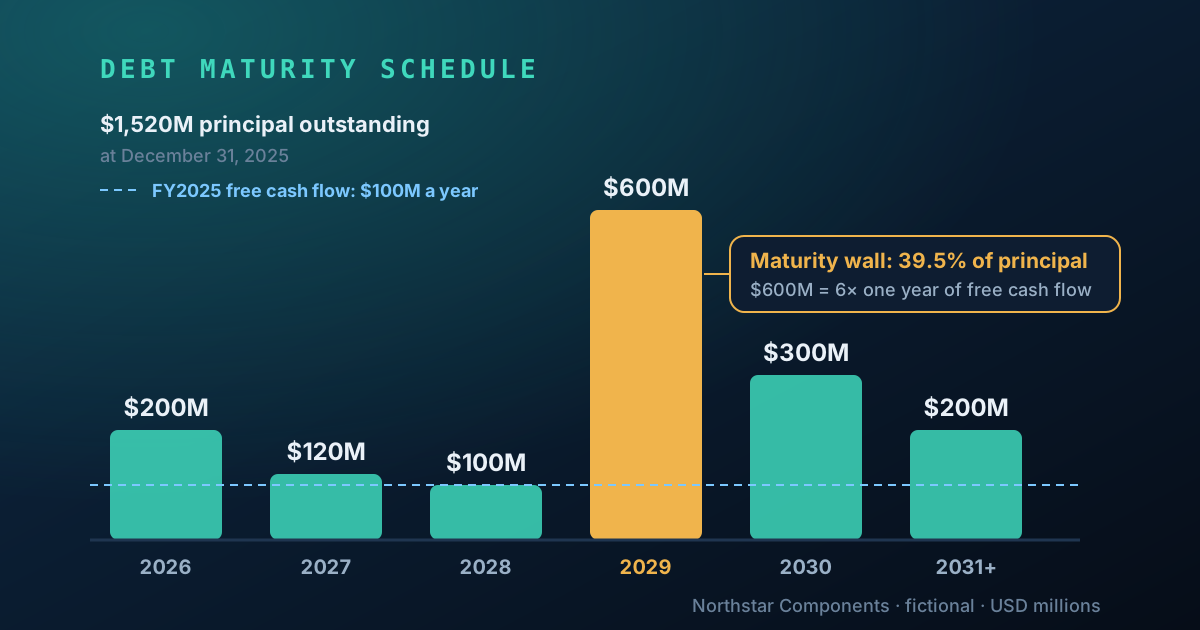
Consider Northstar Components, a fictional manufacturer with $1.52 billion of outstanding debt principal at December 31, 2025.
Its scheduled principal maturities are:
| Year | Principal due | Percentage of total |
|---|---|---|
| 2026 | $200M | 13.2% |
| 2027 | $120M | 7.9% |
| 2028 | $100M | 6.6% |
| 2029 | $600M | 39.5% |
| 2030 | $300M | 19.7% |
| 2031 and beyond | $200M | 13.2% |
| Total | $1,520M | 100.0% |
Percentages are rounded.
The schedule reveals a significant concentration in 2029, when approximately 39.5% of outstanding debt principal becomes due.
This concentration is commonly described as a maturity wall.
A maturity wall does not automatically indicate default risk, but it creates a financing event that deserves focused attention.
3. Compare Maturities with Cash Generation
A debt maturity should never be evaluated in isolation.
Northstar’s fictional FY2025 results include:
| Metric | Amount |
|---|---|
| Operating cash flow | $250M |
| Capital expenditures | $150M |
| Simplified free cash flow | $100M |
| Cash and cash equivalents | $260M |
The company’s annual free cash flow is calculated as:
Free cash flow = Operating cash flow − Capital expenditures
$250M − $150M = $100M
At that level of cash generation, the $600 million scheduled for 2029 equals six times one year’s free cash flow.
That does not mean repayment is impossible.
The company may accumulate cash over several years, sell assets, reduce distributions, refinance the debt, or use other available financing sources.
However, it does mean that the maturity cannot be assumed to be comfortably covered by one year’s historical free cash flow.
The analyst must assess the realistic funding options available when the obligation becomes due.
4. Analyze Near-Term Liquidity
Northstar holds $260 million in cash and has a revolving credit facility with potential undrawn availability of $300 million.
That produces an initial liquidity calculation of:
$260M + $300M = $560M
At first glance, this appears to provide coverage against the $200 million scheduled to mature in 2026.
But the conclusion requires qualification.
Cash may be needed for ordinary operations, payroll, working capital, and other commitments. Borrowing capacity may be restricted by contractual terms, lender conditions, or collateral availability.
Interest payments, taxes, capital investment, and other obligations also compete for cash.
Therefore, $560 million is only a simplified gross liquidity indicator, not proof that the entire amount is available for debt repayment.
A proper analysis asks how much liquidity remains after unavoidable operating needs and contractual restrictions.
5. Why Refinancing Risk Changes with Market Conditions
A company’s ability to refinance depends on more than its historical results.
Three factors are particularly important.
Interest Rates
If borrowing costs increase, a company replacing maturing debt may face higher annual interest payments.
Higher interest expense can reduce free cash flow and weaken interest-coverage ratios.
The impact depends on whether the existing debt is fixed-rate or floating-rate and the terms of the replacement financing.
Credit Market Access
A company may have adequate earnings but still encounter refinancing challenges during periods of reduced credit availability.
Investors and banks may require higher spreads, stronger collateral, lower leverage, or more restrictive covenants.
Company-Specific Credit Quality
Declining earnings, weaker cash generation, litigation, operating disruptions, or adverse industry developments can limit financing options.
A maturity wall becomes more concerning when several of these pressures occur together.
6. Stress-Test the Repayment Capacity
Base-case forecasts are rarely sufficient for a meaningful credit review.
A creditor should evaluate what happens if performance deteriorates.
Consider a purely illustrative downside scenario for Northstar.
| Metric | FY2025 reference | Hypothetical downside |
|---|---|---|
| Operating cash flow | $250M | $175M |
| Capital expenditures | $150M | $150M |
| Free cash flow | $100M | $25M |
| EBITDA proxy | $360M | $270M |
Under this scenario, free cash flow falls from $100 million to $25 million.
If we hold net debt constant at the original $1.26 billion purely for calculation, simplified net leverage increases from 3.50× to approximately 4.67×.
In reality, net debt might also increase if weaker operations require additional borrowing or reduce cash balances.
The key lesson is that refinancing pressure can increase even without a new debt issuance.
A decline in earnings or cash generation can make the existing capital structure more difficult to support.
This scenario is an educational sensitivity calculation, not a forecast of Northstar’s performance.
7. Look for Early Warning Indicators
Debt maturity analysis becomes more useful when paired with forward-looking indicators.
Declining free cash flow: Less internally generated cash is available for future repayment.
Increasing leverage: Borrowings grow relative to the earnings supporting them.
Reduced revolving availability: Liquidity flexibility may be tightening.
Shrinking covenant headroom: The company may approach contractual restrictions before experiencing a payment default.
Rising borrowing costs: Refinancing may become more expensive, placing additional pressure on future cash generation.
Repeated maturity extensions: Amendments may indicate successful proactive financing or financial stress. The surrounding circumstances matter.
No single indicator proves that a company is approaching financial distress.
The analyst should evaluate how these developments interact over time.
8. Separate Reported Maturities from Subsequent Events
A maturity schedule reflects the obligations outstanding at a particular reporting date.
It does not automatically reflect what happened afterward.
Suppose Northstar’s December 2025 schedule shows $200 million due in 2026.
If the company refinances that amount in September 2026, the original annual schedule remains a correct historical disclosure, but it no longer represents the same remaining obligation at the later date.
A current analysis should present both facts clearly:
Annual reporting position: $200 million scheduled for 2026 at December 31, 2025.
Subsequent development: Financing terms changed in September 2026, supported by the actual amendment or filing.
For this fictional example, no such amendment has been assumed or verified.
In real analysis, the latest quarterly report and relevant subsequent events must be reviewed before describing present-day maturities.
9. The Questions Every Credit Analyst Should Ask
Before completing a refinancing-risk assessment, confirm:
- Does the maturity schedule reconcile to outstanding debt principal?
- Which maturities fall due in the next 12, 24, and 36 months?
- Is there a concentration of repayments in one period?
- How much liquidity is genuinely available?
- What cash flow could be generated before each maturity?
- Which contractual restrictions could limit refinancing?
- Have debt terms changed since the reporting date?
- What would happen under a realistic downside scenario?
If an answer cannot be supported by available disclosures, the uncertainty belongs in the credit assessment.
Final Thoughts
Leverage tells us how much debt a company carries relative to a financial measure.
A maturity schedule tells us when the company must confront that debt.
Both perspectives are necessary.
For financial institutions, portfolio managers, and counterparties, the most valuable analysis connects contractual repayment dates with cash flow, liquidity, financing flexibility, and evolving business risks.
A trustworthy assessment should make the source and date of each maturity visible, distinguish confirmed terms from assumptions, and disclose unresolved information.
Further reading: SEC — Using EDGAR to Research Investments · BINarrator.ai — Covenant Headroom
Northstar Components is fictional. All figures and downside scenarios are illustrative. This article provides general educational information and is not a forecast, credit rating, or investment recommendation.
Explore evidence-backed credit intelligence.
Explore sample report