 BINarrator
How to Analyze a Company’s Credit Risk Using Its 10-K
An analyst’s practical guide to understanding financial strength, debt obligations, liquidity, and the risks hidden within annual disclosures.
Credit AnalysisSEC Filings
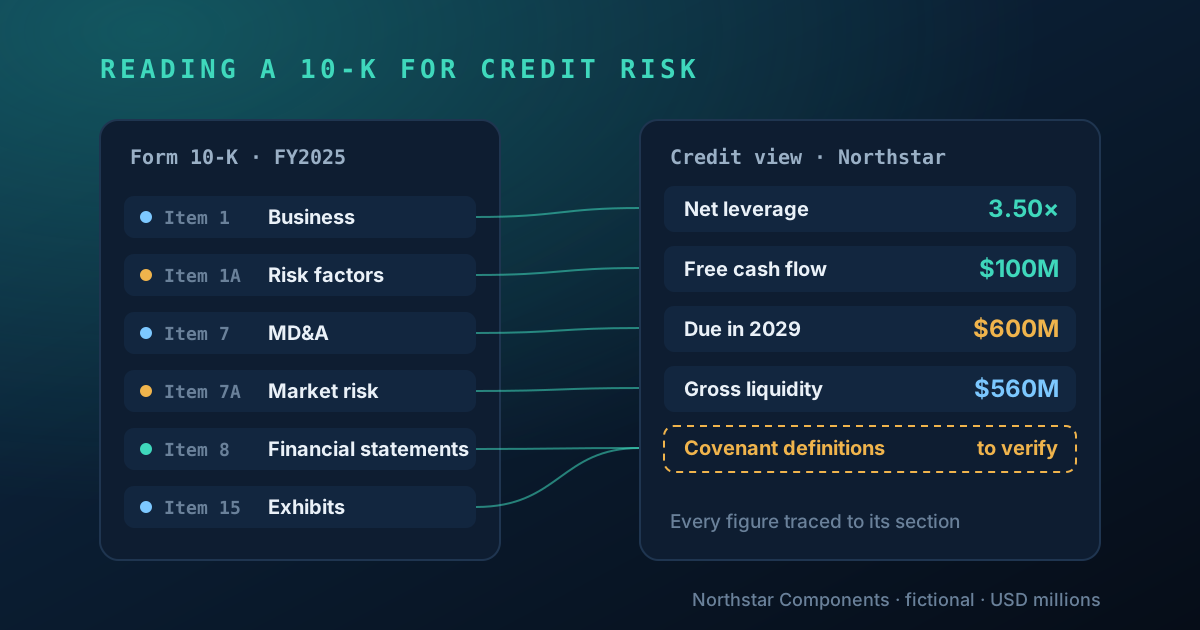
A company can report billions in revenue, consistent profitability, and strong business growth—and still face serious credit risk.
Why? Because profitability and the ability to repay debt are not the same thing.
A profitable business may have significant borrowing obligations, limited available cash, restrictive loan covenants, or a large amount of debt approaching maturity. Conversely, a company with substantial borrowings may remain financially resilient if it consistently generates cash and has manageable repayment obligations.
For credit analysts, the challenge is not simply collecting financial figures. It is understanding how those figures relate to the company’s ability to meet its financial commitments.
One of the most important starting points is the company’s annual Form 10-K.
1. What Is a 10-K, and Why Does It Matter?
A Form 10-K is the annual report that most U.S. public companies file with the Securities and Exchange Commission (SEC).
It contains detailed information about a company’s operations, financial performance, material risks, management’s financial discussion, and audited annual financial statements.
For credit analysis, several sections are particularly valuable.
| 10-K section | What credit analysts should examine |
|---|---|
| Item 1 — Business | Revenue sources, customers, markets, operating structure |
| Item 1A — Risk Factors | Material business, operational, financing, and regulatory risks |
| Item 7 — MD&A | Financial trends, liquidity, capital resources, and management’s explanations |
| Item 7A — Market Risk | Exposure to interest rates, currencies, and other market risks |
| Item 8 — Financial Statements | Profitability, assets, liabilities, cash flows, and supporting notes |
| Item 9A — Controls and Procedures | Internal-control disclosures and potential weaknesses |
| Item 15 — Exhibits | Material agreements, including financing documents when filed |
A strong analysis connects these sections instead of examining them independently.
The financial statements tell us what happened. The footnotes explain important details. Management’s discussion provides context. Risk disclosures help identify what could go wrong.
2. Start with the Business, Not the Ratios
Before calculating leverage, understand how the company makes money.
Consider these questions:
- Does the company depend on a small number of customers?
- Are revenues contractual, recurring, cyclical, or transaction-driven?
- Are operating costs sensitive to commodities, labor, or interest rates?
- Does the business require substantial capital expenditure?
- Are its products essential to customers or readily replaceable?
These questions matter because the same financial ratio can mean different things across industries.
For example, a utility with regulated revenue and relatively predictable cash flows may support a different capital structure than a cyclical industrial manufacturer.
Credit analysis must evaluate the business model alongside the balance sheet.
3. Evaluate Profitability and Operating Performance
Revenue growth is important, but creditors are primarily concerned with the company’s ability to generate sufficient earnings and cash to service obligations.
Consider the following fictional manufacturer.
Northstar Components — Illustrative FY2025 Results
All amounts in USD millions.
| Financial metric | FY2025 |
|---|---|
| Revenue | $2,400 |
| Operating income | $255 |
| Depreciation and amortization | $105 |
| Simplified EBITDA proxy | $360 |
| Interest expense | $80 |
| Operating cash flow | $250 |
| Capital expenditures | $150 |
| Free cash flow | $100 |
For this simplified example:
EBITDA proxy = Operating income + Depreciation and amortization
$255M + $105M = $360M
EBITDA is a non-GAAP measure, and this shortcut is only an analytical approximation. Actual EBITDA reconciliations and contractual covenant EBITDA definitions may differ. Analysts should verify the components and avoid assuming the figure represents cash available for debt repayment.
Here, Northstar produces operating earnings, but $150 million of its operating cash flow is absorbed by capital expenditures.
That leaves $100 million in simplified free cash flow before financing flows, acquisitions, dividends, and other potential uses of cash.
This distinction becomes important when analyzing repayment capacity.
4. Analyze the Company’s Debt Structure
The next question is straightforward:
How much does the company actually owe, and when must it repay?
Assume Northstar reports the following outstanding debt principal at December 31, 2025.
| Debt instrument | Principal outstanding |
|---|---|
| Term loan | $600M |
| Senior notes | $800M |
| Revolving credit borrowings | $120M |
| Total debt principal | $1,520M |
The debt footnote should be reviewed for interest rates, maturities, guarantees, collateral, borrowing terms, and contractual restrictions.
Total debt on its own does not tell us whether the amount is manageable. We also need to evaluate cash and earnings.
Gross and Net Leverage
Assume Northstar holds $260 million in cash and cash equivalents.
Gross debt / EBITDA proxy
$1,520M ÷ $360M = 4.22×
Simplified net debt
$1,520M − $260M = $1,260M
Simplified net leverage
$1,260M ÷ $360M = 3.50×
The company therefore has significant debt relative to its annual EBITDA proxy.
However, neither ratio establishes covenant compliance. Debt definitions, eligible cash, permitted adjustments, and EBITDA definitions must be obtained from the relevant agreement.
These ratios are analytical indicators, not credit ratings.
5. Examine Liquidity—Not Just Cash
Credit risk is also about timing.
A business may generate enough earnings over several years to support its debt but still experience difficulty meeting a large payment due next quarter.
Assume Northstar has:
| Liquidity component | Amount |
|---|---|
| Cash and cash equivalents | $260M |
| Total revolving credit commitment | $450M |
| Less: revolving borrowings | ($120M) |
| Less: letters of credit | ($30M) |
| Potential remaining revolving availability | $300M |
The combined amount is $560 million before adjustments.
But this is not automatically $560 million of unrestricted liquidity.
The analyst must determine whether cash is restricted, whether unused borrowing capacity is actually available, and whether any covenant, collateral, borrowing-base, or other conditions limit access.
The revolving facility’s unused commitment is not existing cash or outstanding debt.
6. Evaluate Debt Maturities
The timing of debt repayment often reveals risks that leverage ratios cannot.
Suppose Northstar’s principal repayments include:
| Maturity year | Principal due |
|---|---|
| 2026 | $200M |
| 2027 | $120M |
| 2028 | $100M |
| 2029 | $600M |
| 2030 | $300M |
| 2031 and later | $200M |
| Total | $1,520M |
The most notable exposure is 2029, when $600 million comes due.
That amount represents approximately 39.5% of outstanding principal and is six times the company’s FY2025 free cash flow.
Northstar might refinance the debt, repay part of it through accumulated cash flow, or obtain additional financing. But none of those outcomes should be assumed.
A creditor should evaluate financing access, expected cash generation, contractual restrictions, and downside scenarios.
7. Read Beyond the Numbers
Financial analysis should also identify risks that may not be apparent in a spreadsheet.
Examples include:
Customer concentration: Losing a major customer could reduce revenue and operating cash flow.
Interest-rate exposure: Floating-rate debt can increase interest expense when benchmark rates rise.
Covenant restrictions: A company may have cash available but limited flexibility to borrow or make certain payments.
Guarantees and commitments: Obligations outside the main debt balance may still affect future liquidity.
Accounting uncertainty: Restatements, material weaknesses, or significant accounting judgments can change confidence in reported information.
When an important item is not disclosed, the correct response is to record an information gap—not assume the exposure is zero.
8. Do Not Stop at the Annual Filing
A 10-K is a historical document.
Before preparing a current credit recommendation, review the latest available 10-Q filings, relevant 8-K events, and updated financing documents.
A company may have refinanced debt, completed an acquisition, amended covenants, or experienced a significant operating change after its fiscal year-end.
Annual historical figures and subsequent developments should retain their original reporting dates. Do not silently combine figures from different periods.
9. Bringing It Together: A Preliminary Credit Assessment
Based only on the fictional FY2025 information, Northstar presents a mixed credit profile.
Potential strengths: Positive operating cash flow, positive free cash flow, and cash holdings that provide an initial source of liquidity.
Potential concerns: Significant leverage relative to the EBITDA proxy, limited annual free cash flow compared with debt principal, and concentrated maturities in 2029.
Information still required: Actual covenant definitions and compliance, cash restrictions, borrowing availability, updated quarterly results, and relevant post-year-end events.
The appropriate conclusion is not an automatic approval or rejection.
It is a clearly documented preliminary assessment identifying what is known, what needs verification, and which risks require further investigation.
Final Thoughts
An effective credit review is not simply a collection of financial ratios.
It is a structured assessment of a company’s business resilience, debt obligations, cash generation, financing flexibility, and vulnerability to adverse developments.
The value of an analysis depends on the quality of the evidence supporting it.
At BINarrator.ai, our focus is on making corporate credit intelligence easier to inspect—connecting reported figures and analytical conclusions to their supporting information while making evidence gaps visible.
Further reading: SEC — How to Read a 10-K/10-Q · SEC — Non-GAAP Financial Measures
Educational content only. Northstar Components and its financial figures are fictional. This article does not constitute investment advice, a credit rating, or a lending recommendation.
Explore BINarrator.ai’s fictional sample credit report.
Explore sample report